
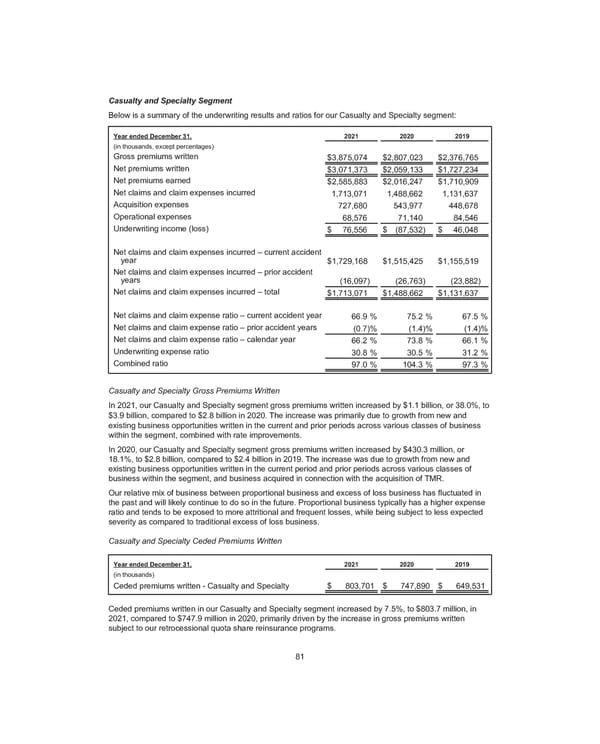
Casualty and Specialty Segment Below is a summary of the underwriting results and ratios for our Casualty and Specialty segment: Year ended December 31, 2021 2020 2019 (in thousands, except percentages) Gross premiums written $ 3,875,074 $ 2,807,023 $ 2,376,765 Net premiums written $ 3,071,373 $ 2,059,133 $ 1,727,234 Net premiums earned $ 2,585,883 $ 2,016,247 $ 1,710,909 Net claims and claim expenses incurred 1,713,071 1,488,662 1,131,637 Acquisition expenses 727,680 543,977 448,678 Operational expenses 68,576 71,140 84,546 Underwriting income (loss) $ 76,556 $ (87,532) $ 46,048 Net claims and claim expenses incurred – current accident year $ 1,729,168 $ 1,515,425 $ 1,155,519 Net claims and claim expenses incurred – prior accident years (16,097) (26,763) (23,882) Net claims and claim expenses incurred – total $ 1,713,071 $ 1,488,662 $ 1,131,637 Net claims and claim expense ratio – current accident year 66.9 % 75.2 % 67.5 % Net claims and claim expense ratio – prior accident years (0.7) % (1.4) % (1.4) % Net claims and claim expense ratio – calendar year 66.2 % 73.8 % 66.1 % Underwriting expense ratio 30.8 % 30.5 % 31.2 % Combined ratio 97.0 % 104.3 % 97.3 % Casualty and Specialty Gross Premiums Written In 2021, our Casualty and Specialty segment gross premiums written increased by $1.1 billion, or 38.0%, to $3.9 billion, compared to $2.8 billion in 2020. The increase was primarily due to growth from new and existing business opportunities written in the current and prior periods across various classes of business within the segment, combined with rate improvements. In 2020, our Casualty and Specialty segment gross premiums written increased by $430.3 million, or 18.1%, to $2.8 billion, compared to $2.4 billion in 2019. The increase was due to growth from new and existing business opportunities written in the current period and prior periods across various classes of business within the segment, and business acquired in connection with the acquisition of TMR. Our relative mix of business between proportional business and excess of loss business has fluctuated in the past and will likely continue to do so in the future. Proportional business typically has a higher expense ratio and tends to be exposed to more attritional and frequent losses, while being subject to less expected severity as compared to traditional excess of loss business. Casualty and Specialty Ceded Premiums Written Year ended December 31, 2021 2020 2019 (in thousands) Ceded premiums written - Casualty and Specialty $ 803,701 $ 747,890 $ 649,531 Ceded premiums written in our Casualty and Specialty segment increased by 7.5%, to $803.7 million, in 2021, compared to $747.9 million in 2020, primarily driven by the increase in gross premiums written subject to our retrocessional quota share reinsurance programs. 81
 2021 Annual Report Page 96 Page 98