
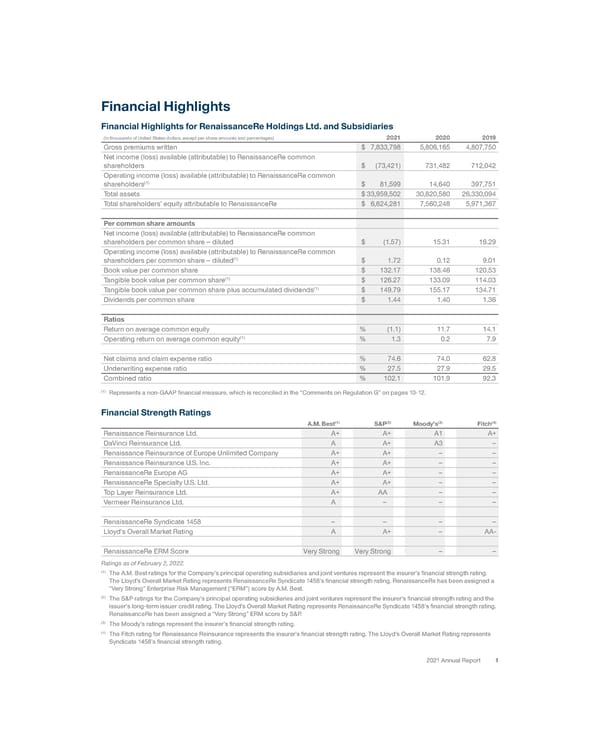
Financial Highlights Financial Highlights for RenaissanceRe Holdings Ltd. and Subsidiaries (In thousands of United States dollars, except per share amounts and percentages) 2021 2020 2 019 Gross premiums written $ 7,833,798 5,806,165 4,807,750 Net income (loss) available (attributable) to RenaissanceRe common shareholders $ (73,421) 731,482 712,042 Operating income (loss) available (attributable) to RenaissanceRe common shareholders (1) $ 81,599 14,640 397,751 Total assets $ 33,959,502 30,820,580 26,330,094 Total shareholders’ equity attributable to RenaissanceRe $ 6,624,281 7,560,248 5,971,367 Per common share amounts Net income (loss) available (attributable) to RenaissanceRe common shareholders per common share – diluted $ (1.57) 15.31 16.29 Operating income (loss) available (attributable) to RenaissanceRe common shareholders per common share – diluted (1) $ 1.72 0.12 9.01 Book value per common share $ 132.17 138.46 120.53 Tangible book value per common share (1) $ 126.27 133.09 114.03 Tangible book value per common share plus accumulated dividends (1) $ 149.79 155.17 134.71 Dividends per common share $ 1.44 1.40 1.36 Ratios Return on average common equity % (1.1) 11.7 14.1 Operating return on average common equity (1) % 1.3 0.2 7.9 Net claims and claim expense ratio % 74.6 74.0 62.8 Underwriting expense ratio % 27.5 27.9 29.5 Combined ratio % 102.1 101.9 92.3 (1) Represents a non-GAAP financial measure, which is reconciled in the “Comments on Regulation G” on pages 10- 12 . Financial Strength Ratings A.M. Best (1) S&P (2) Moody’s (3) Fitch (4) Renaissance Reinsurance Ltd. A+ A+ A1 A+ DaVinci Reinsurance Ltd. A A+ A3 – Renaissance Reinsurance of Europe Unlimited Company A+ A+ – – Renaissance Reinsurance U.S. Inc. A+ A+ – – RenaissanceRe Europe AG A+ A+ – – RenaissanceRe Specialty U.S. A+ A+ – – Top Layer Reinsurance Ltd. A+ AA – – Vermeer Reinsurance Ltd. A – – – RenaissanceRe Syndicate 1458 – – – – Lloyd’s Overall Market Rating A A+ – AA- RenaissanceRe ERM Score Very Strong Very Strong – – Ratings as of February 2, 2022. (1) The A.M. Best ratings for the Company’s principal operating subsidiaries and joint ventures represent the insurer’s financial strength rating. The Lloyd’s Overall Market Rating represents RenaissanceRe Syndicate 1458’s financial strength rating. RenaissanceRe has been assigned a “Very Strong” Enterprise Risk Management (“ERM”) score by A.M. Best. (2) The S&P ratings for the Company’s principal operating subsidiaries and joint ventures represent the insurer’s financial strength rating and the issuer’s long-term issuer credit rating. The Lloyd’s Overall Market Rating represents RenaissanceRe Syndicate 1458’s financial strength rating. RenaissanceRe has been assigned a “Very Strong” ERM score by S&P. (3) The Moody’s ratings represent the insurer’s financial strength rating. (4) The Fitch rating for Renaissance Reinsurance represents the insurer’s financial strength rating. The Lloyd’s Overall Market Rating represents Syndicate 1458’s financial strength rating. 1 2021 Annual Report Ltd.
 2021 Annual Report Page 2 Page 4