
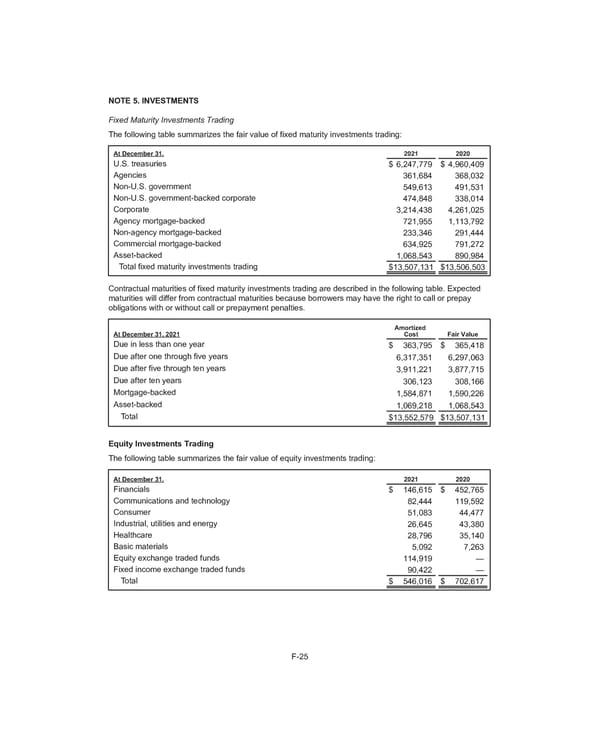
NOTE 5. INVESTMENTS Fixed Maturity Investments Trading The following table summarizes the fair value of fixed maturity investments trading: At December 31. 2021 2020 U.S. treasuries $ 6,247,779 $ 4,960,409 Agencies 361,684 368,032 Non-U.S. government 549,613 491,531 Non-U.S. government-backed corporate 474,848 338,014 Corporate 3,214,438 4,261,025 Agency mortgage-backed 721,955 1,113,792 Non-agency mortgage-backed 233,346 291,444 Commercial mortgage-backed 634,925 791,272 Asset-backed 1,068,543 890,984 Total fixed maturity investments trading $ 13,507,131 $ 13,506,503 Contractual maturities of fixed maturity investments trading are described in the following table. Expected maturities will differ from contractual maturities because borrowers may have the right to call or prepay obligations with or without call or prepayment penalties. At December 31, 2021 Amortized Cost Fair Value Due in less than one year $ 363,795 $ 365,418 Due after one through five years 6,317,351 6,297,063 Due after five through ten years 3,911,221 3,877,715 Due after ten years 306,123 308,166 Mortgage-backed 1,584,871 1,590,226 Asset-backed 1,069,218 1,068,543 Total $ 13,552,579 $ 13,507,131 Equity Investments Trading The following table summarizes the fair value of equity investments trading: At December 31. 2021 2020 Financials $ 146,615 $ 452,765 Communications and technology 82,444 119,592 Consumer 51,083 44,477 Industrial, utilities and energy 26,645 43,380 Healthcare 28,796 35,140 Basic materials 5,092 7,263 Equity exchange traded funds 114,919 — Fixed income exchange traded funds 90,422 — Total $ 546,016 $ 702,617 F-25
 2021 Annual Report Page 167 Page 169