
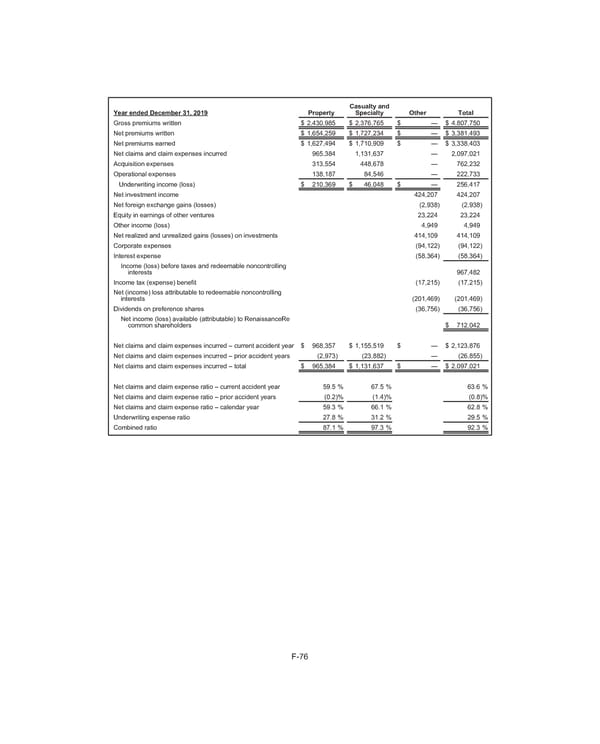
Year ended December 31, 2019 Property Casualty and Specialty Other Total Gross premiums written $ 2,430,985 $ 2,376,765 $ — $ 4,807,750 Net premiums written $ 1,654,259 $ 1,727,234 $ — $ 3,381,493 Net premiums earned $ 1,627,494 $ 1,710,909 $ — $ 3,338,403 Net claims and claim expenses incurred 965,384 1,131,637 — 2,097,021 Acquisition expenses 313,554 448,678 — 762,232 Operational expenses 138,187 84,546 — 222,733 Underwriting income (loss) $ 210,369 $ 46,048 $ — 256,417 Net investment income 424,207 424,207 Net foreign exchange gains (losses) (2,938) (2,938) Equity in earnings of other ventures 23,224 23,224 Other income (loss) 4,949 4,949 Net realized and unrealized gains (losses) on investments 414,109 414,109 Corporate expenses (94,122) (94,122) Interest expense (58,364) (58,364) Income (loss) before taxes and redeemable noncontrolling interests 967,482 Income tax (expense) benefit (17,215) (17,215) Net (income) loss attributable to redeemable noncontrolling interests (201,469) (201,469) Dividends on preference shares (36,756) (36,756) Net income (loss) available (attributable) to RenaissanceRe common shareholders $ 712,042 Net claims and claim expenses incurred – current accident year $ 968,357 $ 1,155,519 $ — $ 2,123,876 Net claims and claim expenses incurred – prior accident years (2,973) (23,882) — (26,855) Net claims and claim expenses incurred – total $ 965,384 $ 1,131,637 $ — $ 2,097,021 Net claims and claim expense ratio – current accident year 59.5 % 67.5 % 63.6 % Net claims and claim expense ratio – prior accident years (0.2) % (1.4) % (0.8) % Net claims and claim expense ratio – calendar year 59.3 % 66.1 % 62.8 % Underwriting expense ratio 27.8 % 31.2 % 29.5 % Combined ratio 87.1 % 97.3 % 92.3 % F-76
 2021 Annual Report Page 218 Page 220