
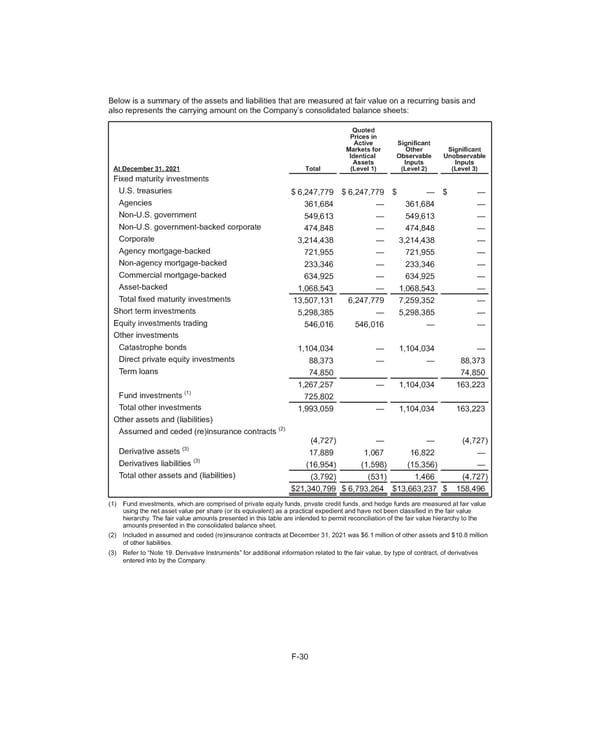
Below is a summary of the assets and liabilities that are measured at fair value on a recurring basis and also represents the carrying amount on the Company’s consolidated balance sheets: At December 31, 2021 Total Quoted Prices in Active Markets for Identical Assets (Level 1) Significant Other Observable Inputs (Level 2) Significant Unobservable Inputs (Level 3) Fixed maturity investments U.S. treasuries $ 6,247,779 $ 6,247,779 $ — $ — Agencies 361,684 — 361,684 — Non-U.S. government 549,613 — 549,613 — Non-U.S. government-backed corporate 474,848 — 474,848 — Corporate 3,214,438 — 3,214,438 — Agency mortgage-backed 721,955 — 721,955 — Non-agency mortgage-backed 233,346 — 233,346 — Commercial mortgage-backed 634,925 — 634,925 — Asset-backed 1,068,543 — 1,068,543 — Total fixed maturity investments 13,507,131 6,247,779 7,259,352 — Short term investments 5,298,385 — 5,298,385 — Equity investments trading 546,016 546,016 — — Other investments Catastrophe bonds 1,104,034 — 1,104,034 — Direct private equity investments 88,373 — — 88,373 Term loans 74,850 74,850 1,267,257 — 1,104,034 163,223 Fund investments (1) 725,802 Total other investments 1,993,059 — 1,104,034 163,223 Other assets and (liabilities) Assumed and ceded (re)insurance contracts (2) (4,727) — — (4,727) Derivative assets (3) 17,889 1,067 16,822 — Derivatives liabilities (3) (16,954) (1,598) (15,356) — Total other assets and (liabilities) (3,792) (531) 1,466 (4,727) $ 21,340,799 $ 6,793,264 $ 13,663,237 $ 158,496 (1) Fund investments, which are comprised of private equity funds, private credit funds, and hedge funds are measured at fair value using the net asset value per share (or its equivalent) as a practical expedient and have not been classified in the fair value hierarchy. The fair value amounts presented in this table are intended to permit reconciliation of the fair value hierarchy to the amounts presented in the consolidated balance sheet. (2) Included in assumed and ceded (re)insurance contracts at December 31, 2021 was $6.1 million of other assets and $10.8 million of other liabilities. (3) Refer to “Note 19. Derivative Instruments” for additional information related to the fair value, by type of contract, of derivatives entered into by the Company. F-30
 2021 Annual Report Page 172 Page 174