
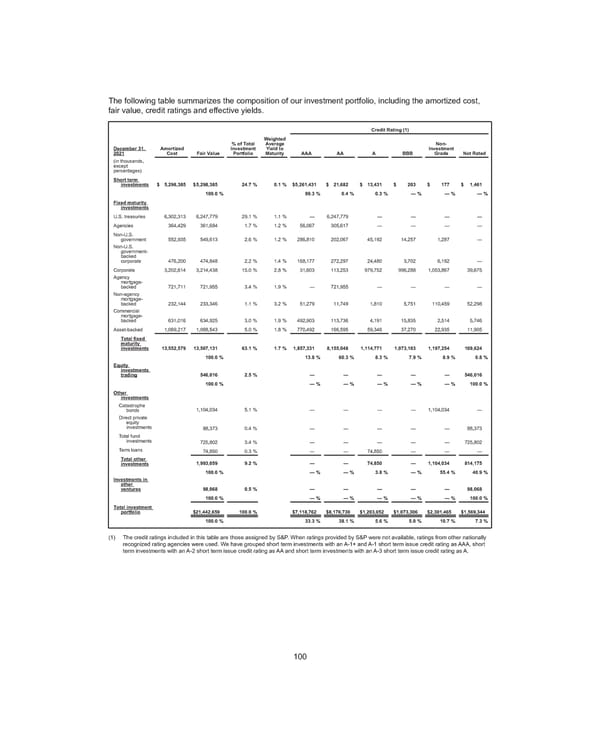
The following table summarizes the composition of our investment portfolio, including the amortized cost, fair value, credit ratings and effective yields. Credit Rating (1) December 31, 2021 Amortized Cost Fair Value % of Total Investment Portfolio Weighted Average Yield to Maturity AAA AA A BBB Non- Investment Grade Not Rated (in thousands, except percentages) Short term investments $ 5,298,385 $ 5,298,385 24.7 % 0.1 % $ 5,261,431 $ 21,682 $ 13,431 $ 203 $ 177 $ 1,461 100.0 % 99.3 % 0.4 % 0.3 % — % — % — % Fixed maturity investments U.S. treasuries 6,302,313 6,247,779 29.1 % 1.1 % — 6,247,779 — — — — Agencies 364,429 361,684 1.7 % 1.2 % 56,067 305,617 — — — — Non-U.S. government 552,935 549,613 2.6 % 1.2 % 286,810 202,067 45,192 14,257 1,287 — Non-U.S. government- backed corporate 476,200 474,848 2.2 % 1.4 % 168,177 272,297 24,480 3,702 6,192 — Corporate 3,202,614 3,214,438 15.0 % 2.8 % 31,603 113,253 979,752 996,288 1,053,867 39,675 Agency mortgage- backed 721,711 721,955 3.4 % 1.9 % — 721,955 — — — — Non-agency mortgage- backed 232,144 233,346 1.1 % 3.2 % 51,279 11,749 1,810 5,751 110,459 52,298 Commercial mortgage- backed 631,016 634,925 3.0 % 1.9 % 492,903 113,736 4,191 15,835 2,514 5,746 Asset-backed 1,069,217 1,068,543 5.0 % 1.8 % 770,492 166,595 59,346 37,270 22,935 11,905 Total fixed maturity investments 13,552,579 13,507,131 63.1 % 1.7 % 1,857,331 8,155,048 1,114,771 1,073,103 1,197,254 109,624 100.0 % 13.8 % 60.3 % 8.3 % 7.9 % 8.9 % 0.8 % Equity investments trading 546,016 2.5 % — — — — — 546,016 100.0 % — % — % — % — % — % 100.0 % Other investments Catastrophe bonds 1,104,034 5.1 % — — — — 1,104,034 — Direct private equity investments 88,373 0.4 % — — — — — 88,373 Total fund investments 725,802 3.4 % — — — — — 725,802 Term loans 74,850 0.3 % — — 74,850 — — — Total other investments 1,993,059 9.2 % — — 74,850 — 1,104,034 814,175 100.0 % — % — % 3.8 % — % 55.4 % 40.9 % Investments in other ventures 98,068 0.5 % — — — — — 98,068 100.0 % — % — % — % — % — % 100.0 % Total investment portfolio $ 21,442,659 100.0 % $ 7,118,762 $ 8,176,730 $ 1,203,052 $ 1,073,306 $ 2,301,465 $ 1,569,344 100.0 % 33.3 % 38.1 % 5.6 % 5.0 % 10.7 % 7.3 % (1) The credit ratings included in this table are those assigned by S&P. When ratings provided by S&P were not available, ratings from other nationally recognized rating agencies were used. We have grouped short term investments with an A-1+ and A-1 short term issue credit rating as AAA, short term investments with an A-2 short term issue credit rating as AA and short term investments with an A-3 short term issue credit rating as A. 100
 2021 Annual Report Page 115 Page 117