
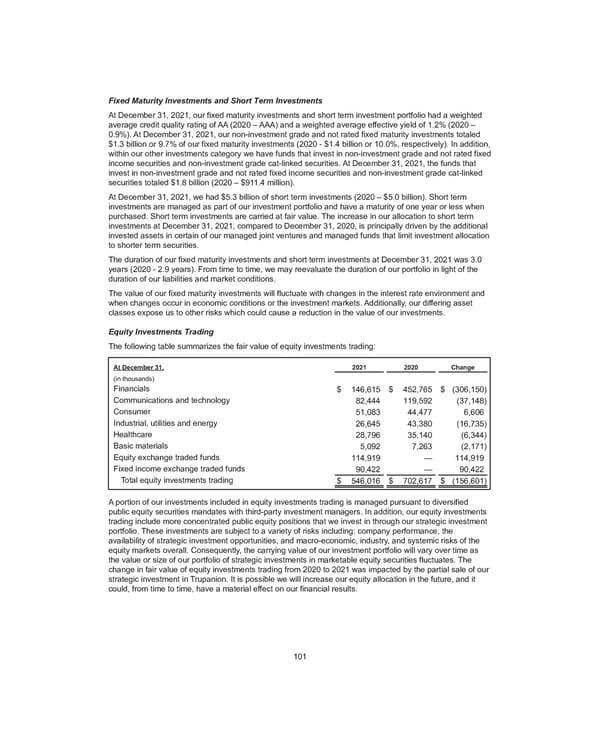
Fixed Maturity Investments and Short Term Investments At December 31, 2021, our fixed maturity investments and short term investment portfolio had a weighted average credit quality rating of AA (2020 – AAA) and a weighted average effective yield of 1.2% (2020 – 0.9%). At December 31, 2021, our non-investment grade and not rated fixed maturity investments totaled $1.3 billion or 9.7% of our fixed maturity investments (2020 - $1.4 billion or 10.0%, respectively). In addition, within our other investments category we have funds that invest in non-investment grade and not rated fixed income securities and non-investment grade cat-linked securities. At December 31, 2021, the funds that invest in non-investment grade and not rated fixed income securities and non-investment grade cat-linked securities totaled $1.8 billion ( 2020 – $911.4 million). At December 31, 2021, we had $5.3 billion o f short term investments (2020 – $5.0 billion). Short term investments are managed as part of our investment portfolio and have a maturity of one year or less when purchased. Short term investments are carried at fair value. The increase in our allocation to short term investments at December 31, 2021, compared to December 31, 2020, is principally driven by the additional invested assets in certain of our managed joint ventures and managed funds that limit investment allocation to shorter term securities. The duration of our fixed maturity investments and short term investments at December 31, 2021 was 3.0 years (2020 - 2.9 years). From time to time, we may reevaluate the duration of our portfolio in light of the duration of our liabilities and market conditions. The value of our fixed maturity investments will fluctuate with changes in the interest rate environment and when changes occur in economic conditions or the investment markets. Additionally, our differing asset classes expose us to other risks which could cause a reduction in the value of our investments. Equity Investments Trading The following table summarizes the fair value of equity investments trading: At December 31, 2021 2020 Change (in thousands) Financials $ 146,615 $ 452,765 $ (306,150) Communications and technology 82,444 119,592 (37,148) Consumer 51,083 44,477 6,606 Industrial, utilities and energy 26,645 43,380 (16,735) Healthcare 28,796 35,140 (6,344) Basic materials 5,092 7,263 (2,171) Equity exchange traded funds 114,919 — 114,919 Fixed income exchange traded funds 90,422 — 90,422 Total equity investments trading $ 546,016 $ 702,617 $ (156,601) A portion of our investments included in equity investments trading is managed pursuant to diversified public equity securities mandates with third-party investment managers. In addition, our equity investments trading include more concentrated public equity positions that we invest in through our strategic investment portfolio. These investments are subject to a variety of risks including: company performance, the availability of strategic investment opportunities, and macro-economic, industry, and systemic risks of the equity markets overall. Consequently, the carrying value of our investment portfolio will vary over time as the value or size of our portfolio of strategic investments in marketable equity securities fluctuates. The change in fair value of equity investments trading from 2020 to 2021 was impacted by the partial sale of our strategic investment in Trupanion. It is possible we will increase our equity allocation in the future, and it could, from time to time, have a material effect on our financial results. 101
 2021 Annual Report Page 116 Page 118