
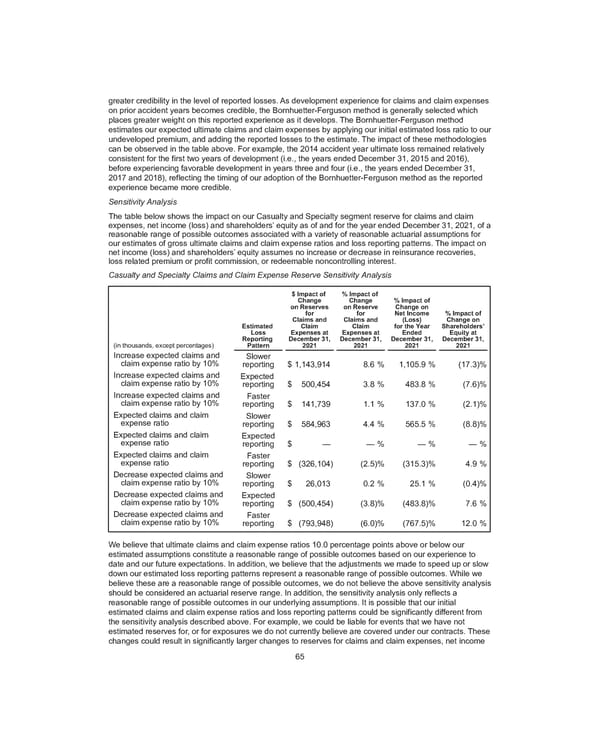
greater credibility in the level of reported losses. As development experience for claims and claim expenses on prior accident years becomes credible, the Bornhuetter-Ferguson method is generally selected which places greater weight on this reported experience as it develops. The Bornhuetter-Ferguson method estimates our expected ultimate claims and claim expenses by applying our initial estimated loss ratio to our undeveloped premium, and adding the reported losses to the estimate. The impact of these methodologies can be observed in the table above. For example, the 2014 accident year ultimate loss remained relatively consistent for the first two years of development (i.e., the years ended December 31, 2015 and 2016), before experiencing favorable development in years three and four (i.e., the years ended December 31, 2017 and 2018), reflecting the timing of our adoption of the Bornhuetter-Ferguson method as the reported experience became more credible. Sensitivity Analysis The table below shows the impact on our Casualty and Specialty segment reserve for claims and claim expenses, net income (loss) and shareholders’ equity as of and for the year ended December 31, 2021, of a reasonable range of possible outcomes associated with a variety of reasonable actuarial assumptions for our estimates of gross ultimate claims and claim expense ratios and loss reporting patterns. The impact on net income (loss) and shareholders’ equity assumes no increase or decrease in reinsurance recoveries, loss related premium or profit commission, or redeemable noncontrolling interest. Casualty and Specialty Claims and Claim Expense Reserve Sensitivity Analysis (in thousands, except percentages) Estimated Loss Reporting Pattern $ Impact of Change on Reserves for Claims and Claim Expenses at December 31, 2021 % Impact of Change on Reserve for Claims and Claim Expenses at December 31, 2021 % Impact of Change on Net Income (Loss) for the Year Ended December 31, 2021 % Impact of Change on Shareholders’ Equity at December 31, 2021 Increase expected claims and claim expense ratio by 10% Slower reporting $ 1,143,914 8.6 % 1,105.9 % (17.3) % Increase expected claims and claim expense ratio by 10% Expected reporting $ 500,454 3.8 % 483.8 % (7.6) % Increase expected claims and claim expense ratio by 10% Faster reporting $ 141,739 1.1 % 137.0 % (2.1) % Expected claims and claim expense ratio Slower reporting $ 584,963 4.4 % 565.5 % (8.8) % Expected claims and claim expense ratio Expected reporting $ — — % — % — % Expected claims and claim expense ratio Faster reporting $ (326,104) (2.5) % (315.3) % 4.9 % Decrease expected claims and claim expense ratio by 10% Slower reporting $ 26,013 0.2 % 25.1 % (0.4) % Decrease expected claims and claim expense ratio by 10% Expected reporting $ (500,454) (3.8) % (483.8) % 7.6 % Decrease expected claims and claim expense ratio by 10% Faster reporting $ (793,948) (6.0) % (767.5) % 12.0 % We believe that ultimate claims and claim expense ratios 10.0 percentage points above or below our estimated assumptions constitute a reasonable range of possible outcomes based on our experience to date and our future expectations. In addition, we believe that the adjustments we made to speed up or slow down our estimated loss reporting patterns represent a reasonable range of possible outcomes. While we believe these are a reasonable range of possible outcomes, we do not believe the above sensitivity analysis should be considered an actuarial reserve range. In addition, the sensitivity analysis only reflects a reasonable range of possible outcomes in our underlying assumptions. It is possible that our initial estimated claims and claim expense ratios and loss reporting patterns could be significantly different from the sensitivity analysis described above. For example, we could be liable for events that we have not estimated reserves for, or for exposures we do not currently believe are covered under our contracts. These changes could result in significantly larger changes to reserves for claims and claim expenses, net income 65
 2021 Annual Report Page 80 Page 82